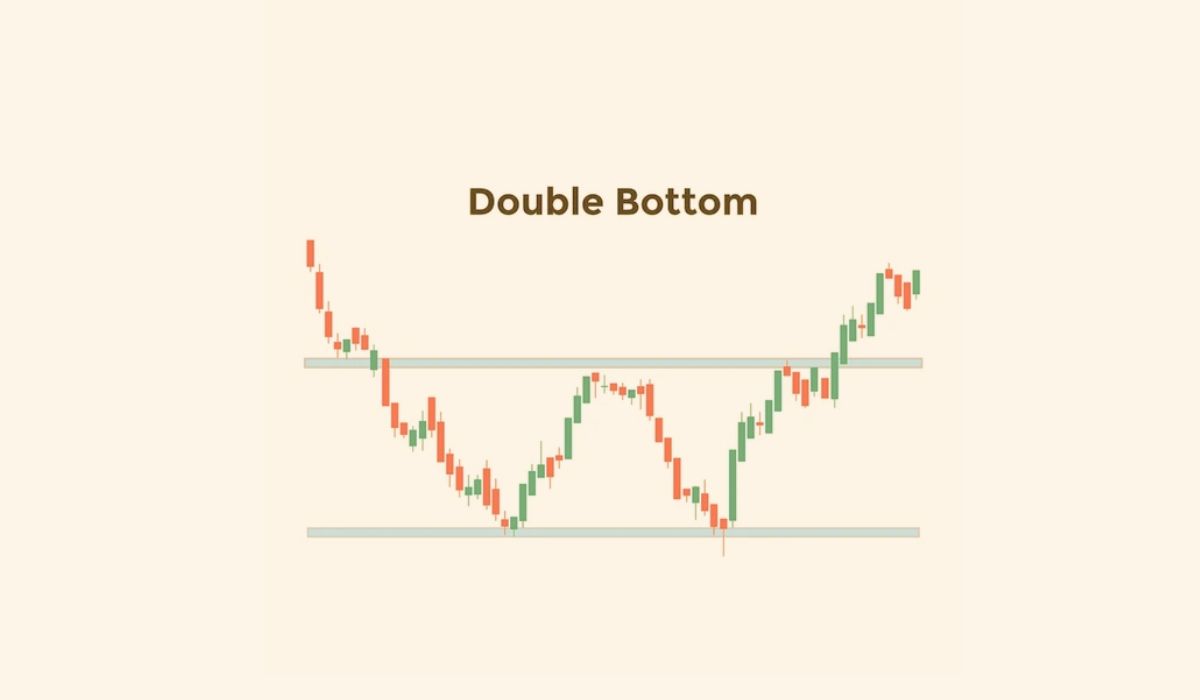
The double bottom can be explained as an indicator that shows positive signals when the stock reaches its low and the second bottom is followed by a constant increase in the stock price. It is inversely proportional to a bearish movement in its stock price. It has two peaks the first peak comes after the bullish movement then it goes down to the low points of the head and shoulder pattern. It suggests that the downtrend is becoming weak and buying options are increasing. This is based on the creation of two price dips at the same level. This becomes an important supporting area under the price which struggles to break. There can be seen a little upward point in between the two lows which trying hard to break the high. This pattern structure shows in the shape of the letter “W” and comes to the name “Double Bottom”.
If the distance between the two lows then it got a higher chance of the trend reversal and the completion of the pattern. The successful completion happens when the buyers show their strength and motive to increase the price, which results in the resistance of sellers to make it lower. The buyers often try to push the price up which makes them called “bulls” as they always charge to push the price. The sellers, on the other hand, are called “bears” because they try to lower the price.
Identifying The Double Bottom Pattern (W) Pattern
There are some steps to identify the pattern on the chart which are mentioned below
- Find The Downtrend: After a steady drop of the price the double bottom will appear.
- Spot The Two Lows At The Same Level: When the price drops it reaches the first bottom then it will climb up. After its change, it again comes down to the same level but will not break and goes deep down.
- Watch Closely On The Neckline: In between the two bottoms, there is a peak that acts as a temporary resistance. The neckline can be found when a horizontal line is drawn at the same level.
- Waiting For The Breakout: It will signal a reversal when the price goes above the neckline after the second bottom. It happens when it has an increase in volume.
- Pattern Confirmation: In some cases, after the break out the price comes back to the neckline and then jumps from there. It will confirm a change to a bull market when the neckline acts as a support in the pattern.
Application Of Double Bottom In Trading
- Understanding The Pattern On The Chart: Looking closely at the downtrend. Watch out for any bouncing to the neckline between the two local bottoms, which indicates resistance. Observing this can help in avoiding making unwanted decisions. Later wait for the price to drop through and break the neckline.
- Pattern Confirming: Monitor the fund and its volume which will automatically go up when the price comes back to the resistance level. Putting an indicator to know the current state of the volume will make it more easy. If the volume which is in the second bottom becomes higher than on the first bottom also if the price breaks through the neckline, then it can be considered as the pattern as confirmed.
- Trade Entering: For further trading, open a long position. Then just below the resistance level set up a stop-loss and by adding the height of the pattern calculate the target price to the breakout point.
Advantages And Disadvantages Of Double Bottom Pattern
The double bottom pattern is a financial instrument and all other financial instruments do have some pros and cons. Now let’s closely look at both the sides:
Advantages
- It is very much easier to understand and set up the entry-level, stop-loss, and take-profit.
- It can work on both versions of time duration whether it is five minutes or daily charts.
- It has been confirmed by many indicators such as RSI (Relative Strength Index), and MACD, and the volume can relatively increase the accuracy of entry.
- More rewarding with extra risk. Even though it has a good risk factor it allows you to get back double what you invested. But this is done through proper management and understanding.
Disadvantages
- There is a lack of confirmation when it comes to predicting the price value. It may sometimes break the neckline and suddenly go lower.
- When a higher timeframe is used then it will take days or weeks for its actual formation.
Also Read: Double Top Pattern (M) Explained: How To Spot & Trade It Successfully
Conclusion
To sum up, for finding the market reversals and also entering trades Double Bottom pattern is very important and indeed an efficient tool. Because of its entry and exit points, there is no confusion whatsoever, it is clear and straightforward and also very reliable. It is very user friendly which makes it easy to use for both new and experienced traders all thanks to different timeframes and trading ideas.