The double-top pattern is an indicator used to indicate a bearish reversal and warns traders about any trend reversal down at the top. This is frequently found in the Forex market, and also in the cryptocurrency, commodity markets, and stocks. Both intraday and long-term traders use this. This shows that the price of the fund is overvalued. It also shows the price is increased with minimum corrections. Later with a definitive uptrend, the formed pattern will have two highs at the resistant level which is the same. In another scenario, the second high may get a bit higher than the first. Simultaneously, an intermediate downward correction will be visible between the two tops, which makes it in the shape of the letter “M”.
Later the formation of two tops, it began to create the starting of a downtrend because of the quote of asset reverse down. The downtrend will get too much intense when the price reaches the support line. But there are several situations where the buyers would manage to hold the support level which leads to the price going up.
Identifying Double Top
Important steps are taken to identify the double top. It is always important to keep in mind that every instance will be different from one another. Also, there are chances for false signals which leads to confusion for the investors about the formation of the double top. The steps for identifying are mentioned below
- Watch Out For An Upswing: After the double top is created the price movement will be visible as an uptrend. By this, it can be identified that the price making growth higher highs and higher lows.
- Spot The Initial Peak: Find the uptrend’s first peak. The price is grown to its maximum peak before coming down.
- Spot The Trough: By tailing the initial peak, it will lead to the falling of price. Find the trough, also known as the valley, which develops through tailing the initial peak.
- Spot The Second Peak: To hit a new high the price will once again rise. And this will fall short of the first peak’s height and then again collapse.
- Confirm The Pattern: It has to be made sure that the downward rate that is trailing the second peak is lower than the trough that follows the first peak. It shows that the resistance level that happened before was not overcome by the price successfully.
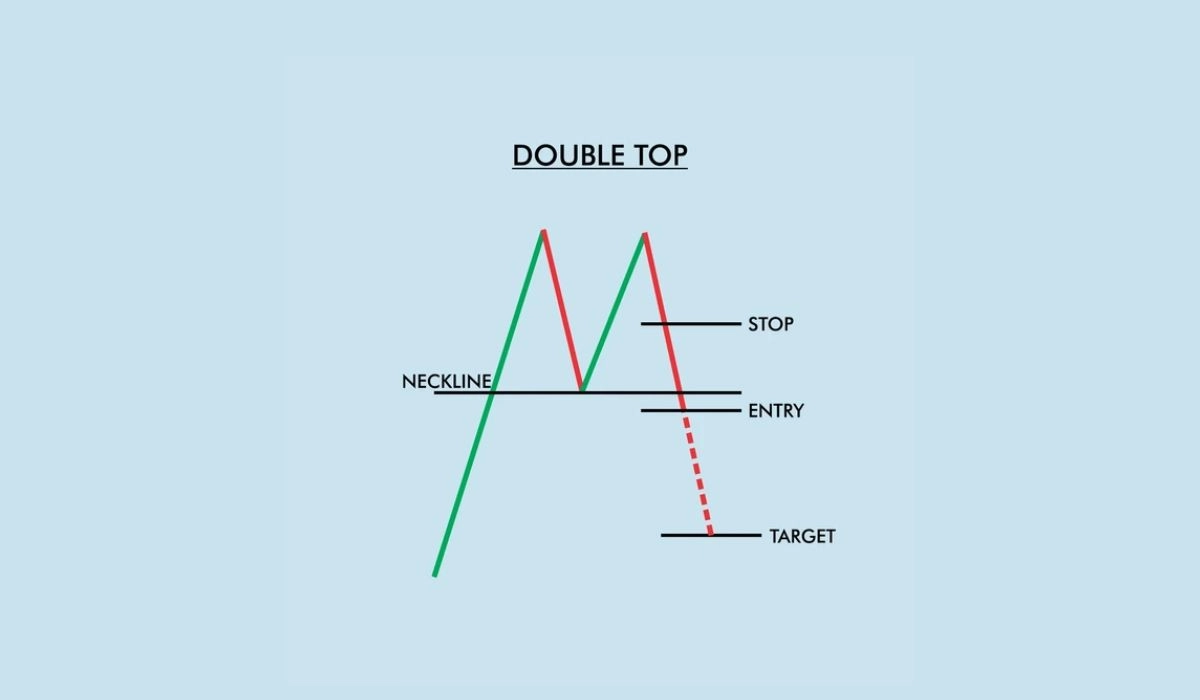
- Form The Neckline: The low points of the trough are connected by a horizontal line. It gives a reference for essential patterns.
- Confirm The Double Top Pattern: This is done by looking at the price break under the neckline. It can be considered as a sell signal as it predicts a possible trend reversal.
How Trading Works In A Double Top?
There are majorly three ways to trade a double top. The first thing to do is to wait for the price to go under the neckline, which will show some hints about trend reversal. After the neckline is crossed, the price will retest it from under continuing its below movement. With this technique, it needs to be watched out for a price break below the neckline, then wait for a withdrawal to the neckline, and find a confirmation signal of bearish movement where a short trade is placed.
A variety of techniques, which consist of projecting the pattern’s height downward or spotting probable support levels are used to establish a profit target. Extra crypto technical indicators can be used to make the double-top pattern more reliable.
Advantages Of Double Top Pattern
- It gives the option to traders to use visual patterns to trade.
- Clear resistance levels are indicated
- Clear communication about entry and exit points.
- Validation is based on the volume of shares traded.
Disadvantages Of Double Top Pattern
- The false signal can happen like any other chart pattern.
- It’s more on subjectivity in the process of identifying pattern.
- Can cause minute variations across investments.
- Can become a limited profile potential.
The double top pattern has the amount of potential that needs to be more profitable if done with good evaluation, handling of risk factors, and understanding of market circumstances. There is no assurance of profitability and there are many chances for the result to be affected based on various aspects.
Conclusion
Many traders and analysts consider the double-top pattern as a bearish indicator. It gives the picture of the upward trend which will slow down and the price may be decreased. The patterns are confirmed by the trades by the use of a neckline which is a horizontal line created in between the lows of the troughs. The analysis that got from the double top pattern also with other technical indicators and various strategies, the trades can improve their skills of decision-making and create more successful chances in the active world of trading.